Microscopy Image Classification
Human Protein Atlas
Code
Abstract
Proteins are “the doers” in the human cell, executing many functions that together enable life. Historically, classification of proteins has been limited to single patterns in one or a few cell types, but in order to fully understand the complexity of the human cell, models must classify mixed patterns across a range of different human cells.
Images visualizing proteins in cells are commonly used for biomedical research, and these cells could hold the key for the next breakthrough in medicine. However, these images are generated at a far greater pace than what can be manually evaluated. Therefore, the need is greater than ever for automating biomedical image analysis to accelerate the understanding of human cells and disease.

Introduction
The Cell Atlas provides high-resolution insights in the spatial distribution of proteins within cells. The atlas contains high-resolution, multicolor immunofluorescence images of cells that detail the subcellular distribution pattern of proteins in these cells. The cells are stained in a standardized way where the antibody of interest is visualized in green, the microtubules red, the endoplasmic reticulum yellow, and nuclei counterstained in blue. The images are manually annotated in terms of spatial distribution to 28 different cellular structures representing 14 major organelles.
The dataset is created by the Human Protein Atlas and can be accessed on their website as well as on Kaggle.
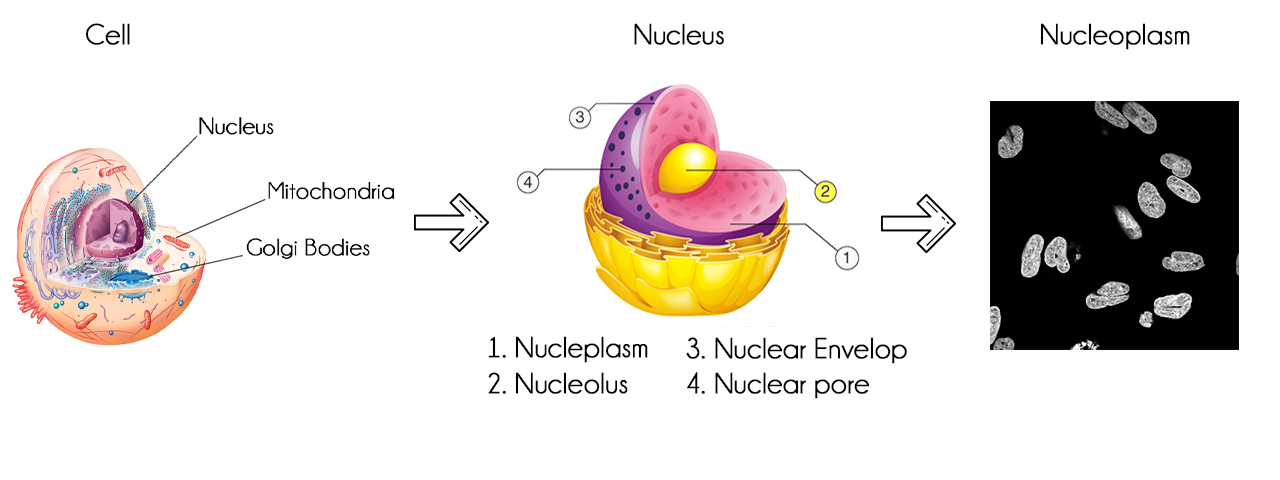
The Human Protein Atlas provides open source data about cells. Datasets contains cell images and .csv file, where .csv file contains id of images and present labels in that image. Total number of individual images are 24000. Each Images are available in 4 individual channels i.e. that is Red, Green, Blue, and Yellow. All these channels are in black and white with pixel color intensity from 0 to 255 and resolution 512x512 pixels.
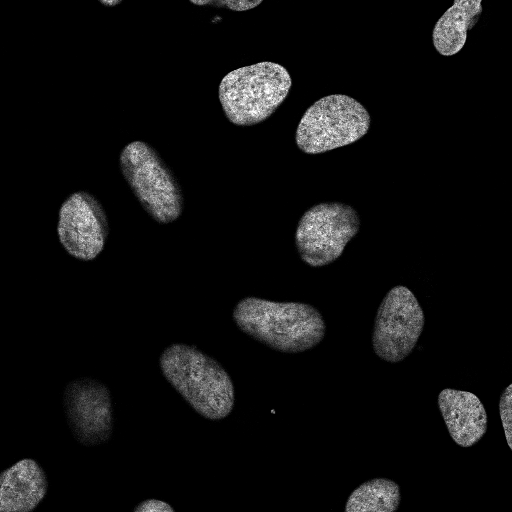
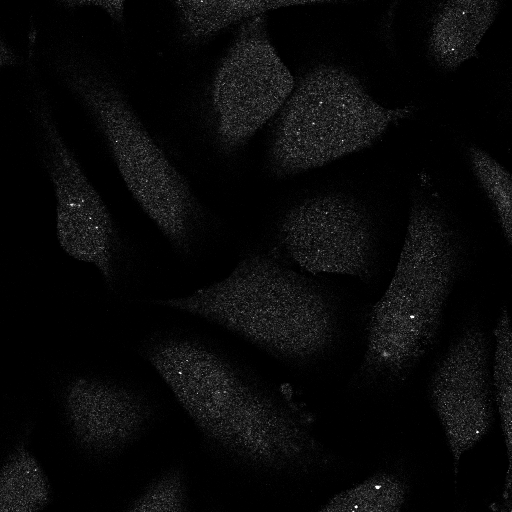
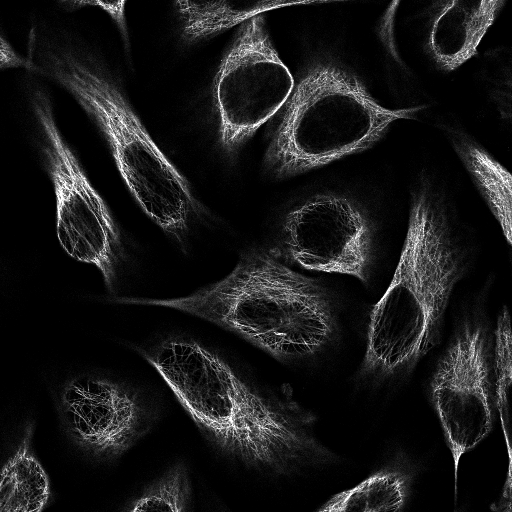
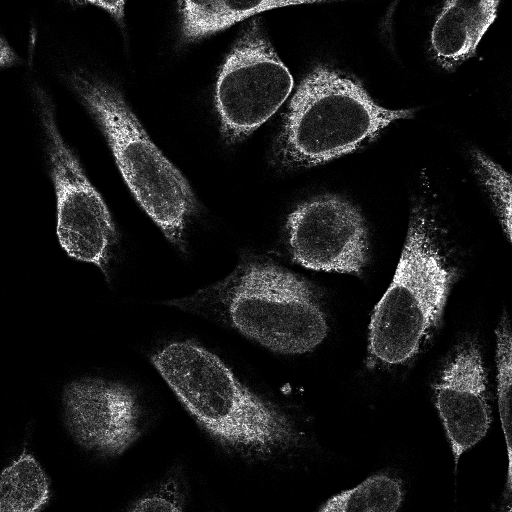
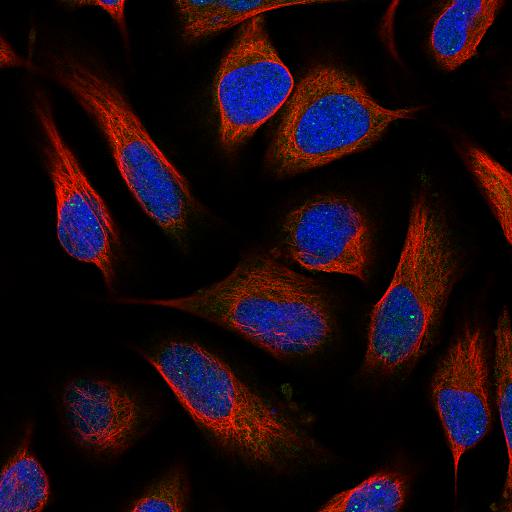
ID: 00c96be4-bbb8-11e8-b2ba-ac1f6b6435d0
There are total 28 different subcellular structures of 14 main organelles are available in the image datasets. The name of the all structures are here,
label_names = {
    0:  "Nucleoplasm",
    1:  "Nuclear membrane",
    2:  "Nucleoli",
    3:  "Nucleoli fibrillar center",
    4:  "Nuclear speckles",
    5:  "Nuclear bodies",
    6:  "Endoplasmic reticulum",
    7:  "Golgi apparatus",
    8:  "Peroxisomes",
    9:  "Endosomes",
    10:  "Lysosomes",
    11:  "Intermediate filaments",
    12:  "Actin filaments",
    13:  "Focal adhesion sites",
    14:  "Microtubules",
    15:  "Microtubule ends",
    16:  "Cytokinetic bridge",
    17:  "Mitotic spindle",
    18:  "Microtubule organizing center",
    19:  "Centrosome",
    20:  "Lipid droplets",
    21:  "Plasma membrane",
    22:  "Cell junctions",
    23:  "Mitochondria",
    24:  "Aggresome",
    25:  "Cytosol",
    26:  "Cytoplasmic bodies",
    27:  "Rods & rings"
}
Data Preprocessing
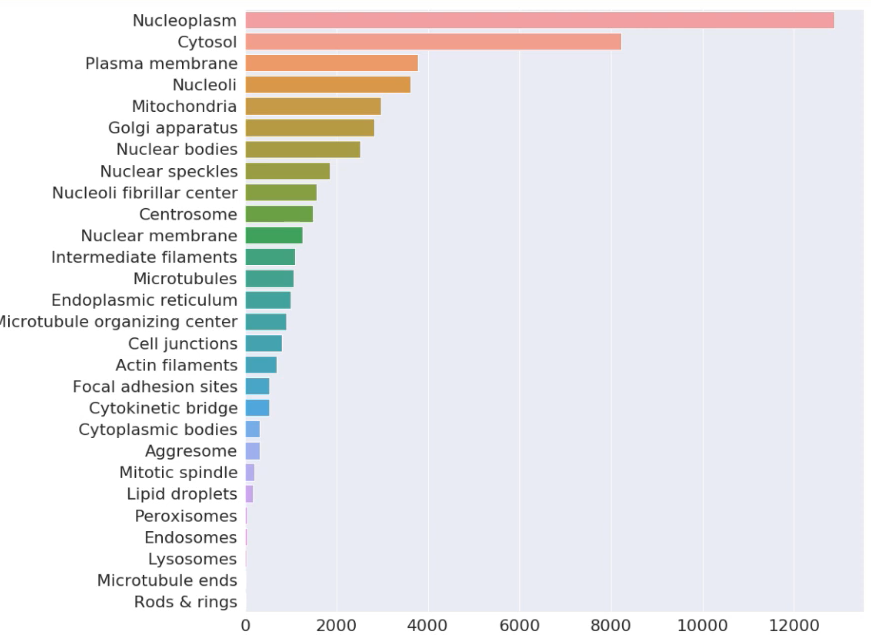
In the Image below, we can observe data imbalance the dataset by Figure 7 below. Nucleoplasm, Cytosol occupies more than more than 60% part of dataset, while Lysosomes, Microtubule ends, Rods-Rings and some others contains very a smaller number of images. It would affect the training process of the model. It is also one of the major concerns.
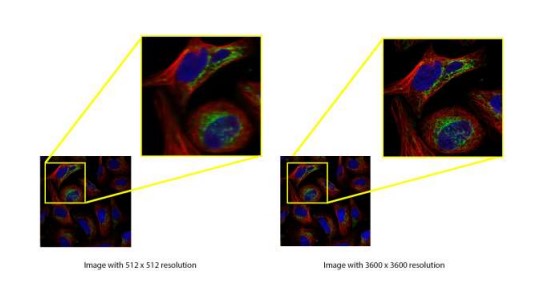
There is also a High-Resolution dataset available on HPA. These images have resolution of 3600x3600 px which has more detailed information of image values. Here is a comparison of both the images compressed low resolution and high resolution. Everything has its own advantages and disadvantages as well. Here in this case using high resolution images means it has very huge number of image parameters to train which require very high-performance Graphic Processing Units (GPU) and Tensor Processing Units (TPU) and more time for training. Here training needs 8+ hours to train the model.
Different Combination of Channels
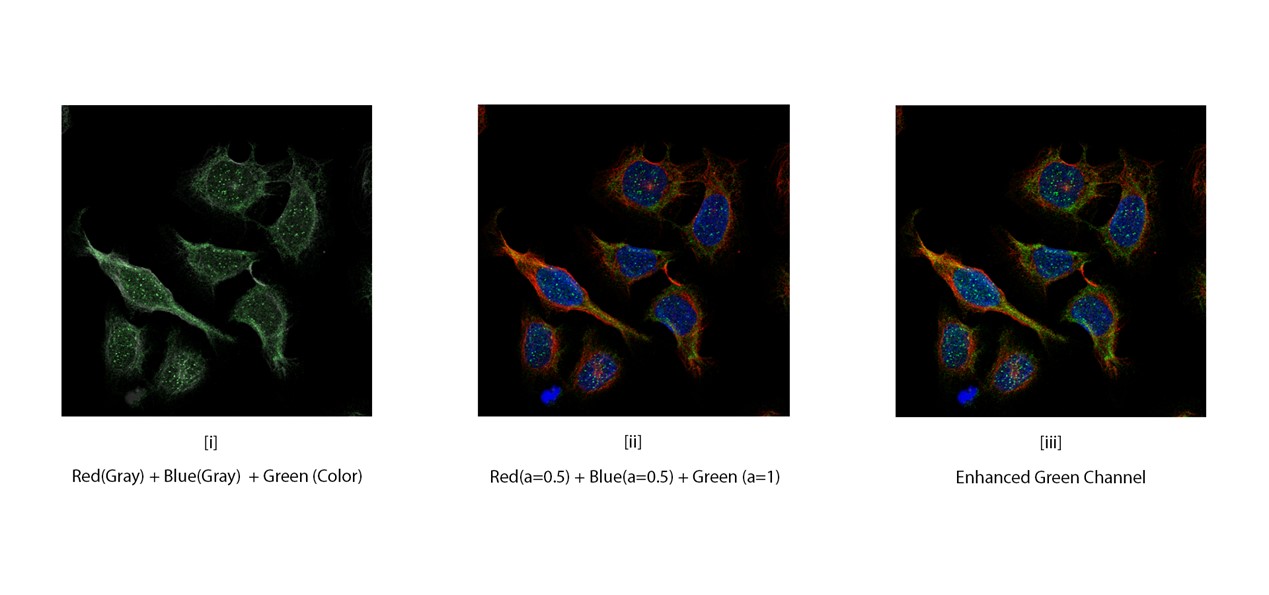
It is important part to gather knowledge about all 4 channels and how individual channel is useful to classify protein in cell. Among all channels Green channel plays important role to predict structure as it suggests interest of protein in cell. So, we tried different combination of channels to prepare images for training process. First, we generate gray scale image by merging Red and Blue image then we add Green color channel. The images are look like as below[i]. Then we generate another dataset in which we reduce alpha channel of Red and Blue channel and add Green channel[ii]. Here we tried to enhance features of Green channel. And lastly, we enhanced Green channel by merging it twice with Red and Blue channel[iii]. So, the philosophy behind merging this all channel gives different perspective to enhance available features in the image to learn the features very well.
Train-Test Split
We are splitting the dataset into three categories (training dataset, cross validation dataset & testing dataset) in order to avoid overfitting. Training dataset will use to train the model. Validation dataset is predominately used to describe the evaluation of models when tuning hyperparameters and data preparation. Test dataset is used to describe the evaluation of a final tuned model.
Data Augmentation
Augmentation is a strategy that enables practitioners to significantly increase the diversity of data available for training models, without actually collecting new data. Therefore, we can have more samples for training and we used this technique to reduce the data imbalance among all the labels by only augmenting the images which contains labels with very a smaller number of training samples. In Augmentation, we are performing certain operations like, rotation, cropping, scaling, horizontal flip, and vertical flip.
Generating Training Batch:
After augmentation we are generating a batch of 4 images and corresponding labels in categorical form that is also known as one hot encoding. The dimensions of each generated batch are k x 512 x 512 x 3 where, k is the number of images per batch which is a hyperparameter of the function.
Model
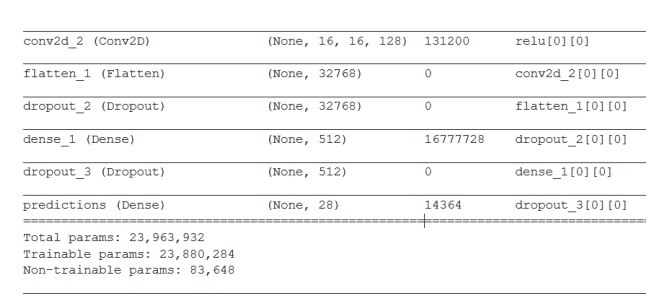
Our model contains mainly DenseNet of total layers 121 with 1 post convolution layer to it. Instead of taking random weights initially we are giving pretrained weights of ImageNet to the DenseNet layer which helps our training process to be faster and more reliable, because it already has some patterns in the feature map of it. Output of the DenseNet will be 16 x 16 x k feature maps. After applying convolution of 128 filters of size 1x1 to remove less significant features and persist 128 most significant features. After this we will flatten it and make 1 x n dimensional tensor where n is the number of total pixels in all the feature maps. Then we are applying Dropout of 0.5 and then apply one fully connected layer. With 512 perceptron with activation function ReLU. And finally, we use one more fully connected layer with n neurons in it where n is the number of total possible classes the dataset (here n = 28) with the activation function sigmoid. Hyperparameters In machine learning, a hyperparameter is a parameter whose value is set before the learning process begins. By contrast, the values of other parameters are derived via training. While compiling the model we are using adam with the learning rate of 0.01 as the optimizer and calculate the loss with equations of binary cross entropy and taking metrics of accuracy.
Comparison
| Method | F1-score |
|---|---|
| All-CNN | 1.62 |
| InceptionResnetV2 | 33.54 |
| DenseNet-201 | 38.25 |
| DenseNet-121 - low res images | 39.87 |
| DenseNet-121 - high res images | 40.25 |
| DenseNet-121 - low res images (Frist 9 labels) | 60.12 |
| DenseNet-121 - high res images (first 9 labels) | 61.39 |
| Human Accuracy | 71.0 |
Future Scope
Class imbalance is the main problem for accurate identification. We can use Autoencoders specifically UNet as an Autoencoder network to solve this problem generating channels from one channel and reduce the class imbalance present in dataset. UNet also can be for biomedical cell segmentation which will make us able to distinguish each cell from available cells in every images. We can also use multiple models in training process. Till now, we used only one CNN model i.e. DenseNet-121 but it can combine and pipeline output of one to input of another model and make it multimodal network . E.g. DenseNer-121 & ResNet & Matric Learning which will let it learn parameters more precisely.